
The Cup and Handle pattern is a bullish continuation pattern used in technical analysis within the stock market, forex trading, and other financial markets. Here’s a detailed breakdown:
What is the Cup and Handle Pattern?
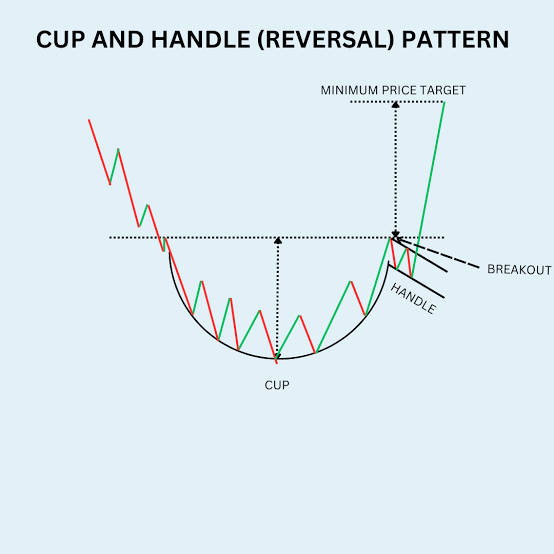
- Cup: The “cup” portion of the pattern resembles a bowl or rounding bottom and represents a consolidation period where the asset’s price levels out after a period of decline. This part of the pattern should be somewhat symmetrical, with the right side of the cup often having a slight higher low than the left side, indicating a potential increase in buying interest.
- Handle: Following the formation of the cup, the “handle” forms, which is a usually a short pullback or consolidation period. The handle can take various forms, like a small downward drift, a flag, or even a slight rounding. It should not retrace more than a third of the cup’s depth to maintain the pattern’s integrity.
Key Characteristics:
- Volume: Typically, volume decreases during the formation of the cup and then increases as the price breaks out of the handle, signaling stronger buying interest.
- Duration: The entire pattern can take anywhere from several weeks to several months to form. The longer the formation, the larger the potential breakout move might be, assuming the pattern holds.
- Breakout: The breakout occurs when the price moves above the resistance level formed by the high of the handle or the upper part of the cup. This breakout should be accompanied by an increase in trading volume for confirmation.
Trading the Pattern:
- Entry Point: Traders often enter the market when the price breaks above the resistance of the handle with increased volume.
- Stop Loss: A stop-loss can be placed below the low of the handle to limit risk if the breakout proves false.
- Price Target: The potential price target can be estimated by measuring the depth of the cup from the bottom to the top and adding this distance to the breakout point of the handle.
Considerations:
- False Breakouts: Not all cup and handle patterns lead to successful breakouts. Sometimes, the price might fail to continue its upward trend after breaking out, leading to a false breakout.
- Context: The pattern should be considered within the broader market context. For instance, if the overall market sentiment is bearish, even a well-formed cup and handle might not perform as expected.
- Confirmation: Look for additional technical indicators or patterns to confirm the breakout, such as moving averages, RSI, or MACD.
The cup and handle pattern, while visually appealing and often discussed, requires careful analysis and should not be the sole basis for trading decisions. It’s most effective when used in conjunction with other forms of analysis to increase the probability of a successful trade.


Leave a comment