
The cryptocurrency market, known for its volatility, often sparks the quest for reliable indicators that can predict significant price movements. Among the tools employed by technical analysts are chart patterns, formations that emerge from historical price data and are believed to forecast future price action. Two such patterns, the cup and handle and the bullish flag, are often cited as harbingers of substantial upward rallies in Bitcoin’s price, with some analysts suggesting a minimum 50% increase upon their completion. However, while these patterns can offer valuable insights, the notion of a guaranteed 50% rally is a simplification of the complexities inherent in market analysis.
Decoding the Bullish Signals: Cup and Handle
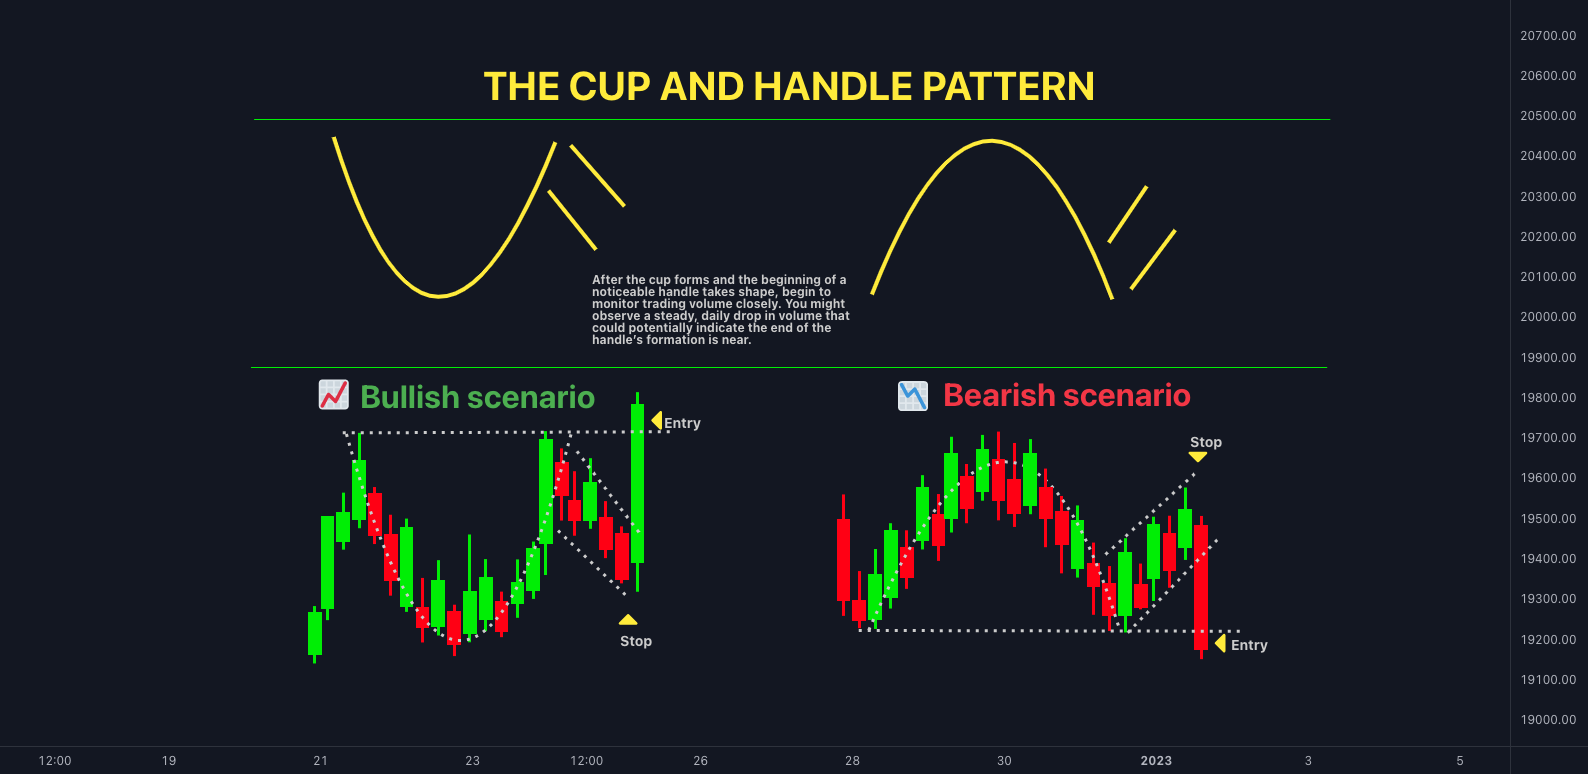
The cup and handle pattern is a bullish continuation pattern that, as its name suggests, resembles a cup with a handle. The “cup” is formed by a gradual decline in price followed by a rounded bottom and a subsequent rally back to the initial high. This phase signifies a period of consolidation where selling pressure is absorbed. The “handle” then develops as a short, downward-sloping consolidation period, typically with lower trading volume, before the price breaks out above the resistance formed by the cup’s high.
Analysts view this breakout as a signal that the prior uptrend is likely to resume with renewed vigor. Price targets are often projected by measuring the depth of the cup and adding that distance to the breakout point. For instance, a prominent crypto analyst identified a multi-year cup and handle pattern on Bitcoin’s chart in March 2025, suggesting a potential surge towards $130,000 or even $186,000 based on different measurement techniques. Another analysis in February 2025 pointed to a $120,000 target following the appearance of a similar formation.
Riding the Flag: The Bullish Flag Pattern
The bullish flag is another bullish continuation pattern that typically forms over a shorter timeframe. It emerges after a sharp upward price movement, known as the “flagpole,” which indicates strong buying pressure. Following this surge, the price enters a period of consolidation, characterized by a small, downward-sloping channel or rectangle – the “flag.” This phase suggests a temporary pause as buyers take profits before the next leg up.
A breakout above the upper trendline of the flag is considered a confirmation of the pattern and signals the continuation of the uptrend. The anticipated price target is often estimated by adding the length of the initial flagpole to the breakout point. In April 2025, a bullish flag pattern observed on Bitcoin’s 4-hour chart hinted at a potential climb towards $103,000. Similarly, in March 2025, the completion of a bullish flag was interpreted as a sign of further upward momentum.
The Nuances of Technical Analysis: Probabilities, Not Promises
While the cup and handle and bullish flag patterns are undeniably bullish formations that can precede significant price increases, it is crucial to avoid the misconception that their appearance guarantees a minimum 50% rally. Technical analysis operates on the principle of probabilities, not certainties. Several factors can influence the reliability and outcome of these patterns:
- Market Conditions: The overall market sentiment, macroeconomic factors, and news events can significantly impact Bitcoin’s price action, potentially overriding the signals from technical patterns.
- Timeframe: The timeframe on which a pattern forms can affect its significance. Patterns on longer-term charts (e.g., weekly, monthly) tend to carry more weight than those on shorter-term charts (e.g., hourly).
- Volume Confirmation: A breakout from a cup and handle or bullish flag should ideally be accompanied by a noticeable increase in trading volume. This surge in volume provides further evidence of strong buying interest and increases the likelihood of the pattern playing out as expected.
- Pattern Validity: Not all formations that resemble these patterns are valid. Specific rules and characteristics define each pattern, and deviations can weaken their predictive power. For instance, an excessively deep handle in a cup and handle or a flag that retraces too much of the flagpole can invalidate the bullish signal.
- Risk Management: Regardless of how bullish a pattern appears, employing proper risk management strategies, such as setting stop-loss orders, is essential to protect capital in case the pattern fails.
Bitcoin’s Current Landscape: April 2025
As of late April 2025, Bitcoin is trading around the $95,000 mark. Recent technical analysis suggests a prevailing bullish sentiment, with potential targets in the $97,000 to $103,000 range, supported by institutional inflows into Bitcoin ETFs and the emergence of bullish flag patterns. However, resistance levels exist, and market participants should remain vigilant for potential pullbacks.
In conclusion, while the cup and handle and bullish flag patterns are valuable tools in a technical analyst’s arsenal and can indeed precede substantial upward movements in Bitcoin’s price, the assertion that they always lead to at least a 50% rally is an overstatement. These patterns highlight periods of potential accumulation and consolidation that can result in significant breakouts, but their success is contingent on a confluence of market factors and proper validation. Traders should use these patterns as part of a comprehensive analysis strategy, incorporating other technical indicators, volume analysis, and an understanding of the broader market context to make informed decisions, rather than relying solely on the appearance of these formations as a guaranteed ticket to a 50% profit. Sources and related content


Leave a comment